🌱 XQQ Key Performance Drivers
An ETF with exposure to the 100 largest non-financial companies listed on the Nasdaq based on market cap is primarily influenced by the following factors:
1. Technology Sector Performance
- Tech-heavy composition: Over 50% of the index is typically allocated to tech companies (e.g., Apple, Microsoft, Nvidia).
- Impact: Any boom or bust in the tech sector (e.g., driven by innovation, regulation, or consumer trends) disproportionately affects the ETF.
2. Interest Rates & Monetary Policy
- Growth stock sensitivity: The ETF is dominated by growth-oriented companies, which are highly sensitive to rising interest rates (which reduce the present value of future earnings).
- Fed actions: Tightening monetary policy (rate hikes, QT) tends to negatively impact this ETF, while easing supports it.
3. Macroeconomic Conditions
- Consumer demand: Companies like Amazon, Tesla, and Meta are affected by consumer spending patterns.
- Global growth: Many constituents operate globally, so global economic slowdowns (e.g., in China or Europe) impact revenues.
4. Market Sentiment & Valuations
- Momentum-driven: The Nasdaq-100 is often driven by investor sentiment toward “big tech” and growth stocks.
- Valuation risks: High P/E ratios can make the ETF vulnerable to corrections when earnings disappoint.
5. Regulatory & Political Risk
- Antitrust scrutiny: U.S. and EU investigations into tech monopolies (e.g., Google, Amazon) can dampen performance.
- Tax policy: Corporate tax increases or new digital service taxes may affect earnings projections.
6. Innovation & Disruption
- AI, cloud computing, biotech: Technological breakthroughs can drive growth among top constituents.
- Conversely, failure to innovate or increased competition (e.g., from China or smaller U.S. firms) can slow growth.
7. U.S. Dollar Strength
- A strong dollar can hurt multinational revenues when foreign sales are converted back to USD, especially for companies with large international exposure.
🔍 XQQ Risk Assessment
As of May 2025, XQQ is rated as medium-to-high risk level by its issuer BlackRock. This ETF has 14 years of history and $3,484M in assets, both of which are above average compared to all iShares ETF on the TSX.
It can be used strategically to diversify into large-cap U.S. companies while avoiding exposure to financial companies, however may not be suitable for more risk-adverse investors and those with shorter investment horizons.
Investing in XQQ gives you exposure to some of the largest and most influential tech-focused companies, like Apple, Microsoft, and Amazon. While these companies have strong growth potential, XQQ can be more volatile than broader market ETFs because it’s heavily concentrated in the technology sector. If tech stocks fall out of favor, or if interest rates rise—which tends to hurt growth stocks—XQQ’s value could drop quickly.
Also, since it tracks U.S. companies, it’s affected by currency fluctuations and economic changes in the U.S. Currency hedging in an ETF helps protect Canadian investors from fluctuations between the Canadian and U.S. dollar, providing more stable returns that closely reflect the underlying index’s performance. This can reduce volatility and make returns more predictable. However, hedging comes with costs, which can slightly lower long-term gains, and may not be perfectly effective in rapidly moving markets. Additionally, in periods when the U.S. dollar strengthens, a hedged ETF may underperform its unhedged counterpart.
Overall, XQQ offers growth potential, but it comes with higher risk and sharper ups and downs.
🧭 XQQ Trend Analysis
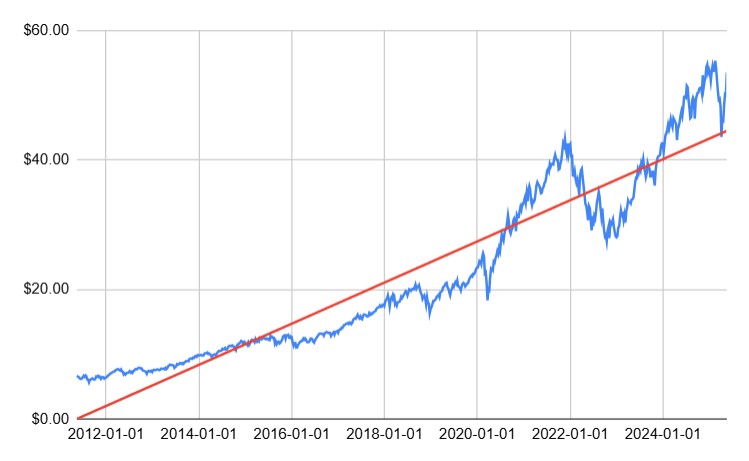
As of May 2025, a linear regression model on 14 years of XQQ timeseries data produces an r-squared of 0.90, indicating a strong upward growth trend in this ETF with 90% of its price variations explained simply by the passage of time. Note however, past performance doesn’t necessarily guarantee future trends will continue the same way.
📈 Key Drivers of XQQ’s Growth Trend from May 2011 to Feb 2020
1. Dominance of Technology Giants
The Nasdaq-100 is heavily weighted toward major technology companies. During this period, firms like Apple, Microsoft, Amazon, Alphabet (Google), and Facebook (now Meta) saw significant revenue and profit growth, fueled by innovations in cloud computing, mobile technology, e-commerce, and digital advertising. These companies’ strong performance had a substantial impact on the index’s overall growth. (Leeds Journal)
2. Post-2008 Economic Recovery
Following the 2008 financial crisis, the U.S. economy entered a prolonged recovery phase. Low interest rates and accommodative monetary policies provided a favorable environment for businesses to invest and expand. This economic backdrop supported steady growth in corporate earnings, particularly benefiting growth-oriented sectors like technology.
3. Advancements in Technology and Innovation
The 2010s witnessed rapid technological advancements, including the proliferation of smartphones, the rise of social media platforms, and significant progress in artificial intelligence and cloud services. These innovations not only transformed consumer behavior but also opened new revenue streams for tech companies, contributing to their stock price appreciation.
4. Investor Appetite for Growth Stocks
In a low-interest-rate environment, investors increasingly sought higher returns through growth stocks, many of which are prominent in the Nasdaq-100. The consistent performance and future growth prospects of these companies attracted substantial investment, further propelling the index upward.
5. Globalization and Market Expansion
Many Nasdaq-100 companies expanded their operations globally, tapping into emerging markets and diversifying their revenue sources. This international growth contributed to their financial strength and stock performance, reinforcing the index’s upward trajectory.
📉 Key Drivers of XQQ’s March 2020 Covid Crash
The sharp decline in March 2020—often referred to as the COVID-19 crash—was triggered by a rapid and widespread panic in global financial markets due to the sudden outbreak of the COVID-19 pandemic. The Nasdaq-100, along with global indices, entered a bear market in record time, dropping more than 20% from recent highs within weeks.
1. COVID-19 Pandemic Shock
- In early March 2020, COVID-19 escalated into a global pandemic, leading to lockdowns across major economies including the U.S., Europe, and Asia.
- Investors feared a deep recession due to halted economic activity, travel bans, supply chain disruptions, and mass business closures.
2. Global Economic Freefall Fears
- The rapid shutdown of businesses and services created expectations of a severe GDP contraction.
- Unemployment in the U.S. spiked, with millions filing for jobless claims in record time, triggering fears of long-term damage to consumer demand.
3. Market Panic & Liquidity Crunch
- A widespread “flight to safety” occurred—investors dumped equities and sought cash or government bonds.
- Even high-quality assets were sold to raise liquidity, causing broad-based declines across all sectors.
4. Extreme Volatility
- March 2020 saw some of the most volatile trading days in market history, with the Nasdaq-100 and other major indices falling over 30% from February highs to March lows.
5. Oil Price War (Saudi-Russia Conflict)
- In early March 2020, Saudi Arabia and Russia failed to agree on oil production cuts, triggering a price war.
- Oil prices plummeted, adding to financial stress and dragging down energy stocks, amplifying market declines.
6. Delayed Initial Policy Response
- In the early days of the crisis, there was uncertainty about the scale and speed of government and central bank intervention.
- Markets reacted negatively to the perceived lack of immediate, coordinated fiscal and monetary responses—though these were ramped up later in March.
📈 Key Drivers of XQQ’s Growth Trend from April 2020 to Nov 2021
1. Ultra-Loose Monetary Policy
- The U.S. Federal Reserve slashed interest rates to near-zero and launched massive asset purchase programs (QE).
- These policies dramatically lowered borrowing costs and pushed investors toward riskier assets like tech stocks, which dominate the Nasdaq-100.
2. Fiscal Stimulus and Direct Payments
- The U.S. government enacted multiple stimulus packages, including direct checks to households and expanded unemployment benefits.
- Much of this cash flowed into financial markets, driving up demand for equities, especially large-cap growth names.
3. Acceleration of Digital Adoption
- Lockdowns and remote work accelerated adoption of digital tools, cloud computing, e-commerce, and streaming services.
- Companies like Zoom, Amazon, Microsoft, and Nvidia saw surging demand, pushing their stock prices sharply higher.
4. Retail Investor Boom
- Platforms like Robinhood saw a surge in new retail traders, many of whom favored tech and growth stocks.
- Social media-driven trading (e.g., Reddit’s WallStreetBets) also contributed to elevated volumes and momentum.
5. “Work From Home” Winners
- Many Nasdaq-100 constituents directly benefited from the shift to remote work and digital consumption.
- Examples:
- Nvidia (data centers, gaming GPUs)
- Apple (iPad/Mac sales)
- Microsoft (Teams, Azure cloud)
- Amazon (online retail, AWS)
- Nvidia (data centers, gaming GPUs)
6. Low Inflation Expectations (Initially)
- Early in the pandemic, inflation was not a major concern, supporting long-duration assets like tech stocks, whose value lies in future earnings.
📉 Key Drivers of XQQ’s Decline Trend from Dec 2021 to Nov 2022
1. Aggressive Interest Rate Hikes by the Federal Reserve
- To combat surging inflation, which reached 40-year highs, the Fed shifted from an accommodative stance to one of the most aggressive tightening cycles in decades.
- Higher interest rates sharply reduced the present value of future earnings, hitting growth stocks (especially tech) hardest—many of which dominate the Nasdaq-100.
2. Inflation and Cost Pressures
- Input costs rose across the board due to supply chain disruptions, energy price spikes, and labor shortages.
- Profit margins came under pressure, leading to disappointing earnings and guidance for many high-growth firms.
3. Valuation Compression
- Many Nasdaq-100 stocks were trading at high price-to-earnings (P/E) ratios after the 2020–2021 rally.
- As rates rose, valuations were reevaluated, triggering multiple compression and steep declines in share prices even if earnings remained solid.
4. Shift in Investor Sentiment
- Investors rotated out of high-growth tech stocks and into defensive or value sectors (e.g., energy, utilities, consumer staples) as uncertainty increased.
- This sector rotation further exacerbated the decline in the Nasdaq-100.
5. Geopolitical Tensions – Russia-Ukraine War
- The February 2022 invasion of Ukraine sparked global market turmoil, especially in energy and commodity markets.
- Uncertainty around global growth and risk aversion led investors to flee riskier assets, including tech-heavy indices.
6. Declines in Key Nasdaq-100 Components
- High-profile disappointments from companies like Meta (Facebook), Netflix, and Amazon—due to slowing growth or poor earnings—added downward pressure to the index.
- Meta alone lost over 70% of its market value during this period due to advertising slowdown and heavy spending on the metaverse.
7. Strong U.S. Dollar
- The dollar surged in 2022, which hurt multinational earnings when foreign revenues were converted back into USD, affecting many Nasdaq-100 companies.
📈 Key Drivers of XQQ’s Growth Trend from Dec 2022 to Feb 2025
1. Artificial Intelligence (AI) Boom
The rapid advancement and adoption of AI technologies significantly boosted the performance of major tech companies within the Nasdaq-100. Companies like Nvidia, Microsoft, and Alphabet saw substantial gains due to increased demand for AI-related products and services. Nvidia, for instance, rose 258% in 2023 and continued its upward trajectory into 2024, becoming the third-largest U.S. company by market capitalization .(LeverageSharesUS)
2. Federal Reserve’s Monetary Policy Shift
In response to easing inflation, the Federal Reserve began cutting interest rates in late 2024, reducing borrowing costs and making equities more attractive. This policy shift provided a tailwind for growth stocks, particularly in the technology sector .(Funky Raccoon AI Market Insights)
3. Strong Corporate Earnings
Despite economic uncertainties, many Nasdaq-100 companies reported robust earnings. For example, in early 2025, 86% of S&P 500 companies (which includes many Nasdaq-100 constituents) beat earnings expectations by an average of 8.2%, indicating strong corporate health and profitability .(Business Insider)
📉 Key Drivers of XQQ’s Decline Trend from Feb-Apr 2025
1. Escalation of Trade Wars and Tariffs
- In early 2025, the U.S. administration implemented substantial tariffs on imports from major trading partners, including Canada, Mexico, and China.
- On March 3, tariffs on Canadian and Mexican imports were enforced, and tariffs on Chinese goods increased from 10% to 20%.
- These actions led to immediate retaliatory tariffs from affected countries, intensifying global trade tensions.(Invesco, Wikipedia)
2. Market Volatility and Investor Sentiment
- The announcement of sweeping tariffs on April 2, dubbed “Liberation Day,” triggered widespread panic in global stock markets.
- The Nasdaq-100 index fell by 2.6% on March 3 and continued to decline in the following days.
- By April 4, the Nasdaq Composite had lost 5.8%, entering bear market territory. (Wikipedia, Wikipedia)
3. Economic Indicators and Recession Fears
- Consumer confidence saw a significant drop, with the University of Michigan Consumer Sentiment Index plunging to 50.8 in April, marking the second-lowest level since records began.
- The Federal Reserve’s GDPNow forecast for Q1 2025 was revised downward from 2.3% to -1.5%, indicating potential economic contraction. (Wikipedia, Invesco)
4. Bond Market Turmoil
- Initially, investors sought refuge in bonds, causing yields to drop.
- However, as confidence waned, a bond sell-off ensued, with the 10-year Treasury yield surging to 4.5% by April 9, the largest three-day jump since 1982. (Wikipedia)
Disclaimer
The content provided on this blog is for informational purposes only and does not constitute financial, investment, or other professional advice. The opinions expressed herein are those of the author(s) and do not reflect the views of any affiliated organizations or institutions.
All investment strategies and investments involve risk of loss. Nothing in this blog should be construed as a recommendation, solicitation, or offer to buy or sell any securities or other financial instruments. You are solely responsible for your investment decisions and should seek the advice of a qualified financial advisor or other professional before making any financial decisions.
The information on this site is provided “as is” without any representations or warranties, express or implied. The author(s) make no representations or warranties in relation to the accuracy, completeness, timeliness, or reliability of any information on this site or found by following any link on this site.
Past performance is not indicative of future results. The author(s) may hold positions in or have other financial interests in securities discussed on this blog.
By using this blog, you agree not to hold the author(s) liable for any losses, damages, or expenses that may arise from reliance on the information provided.
