🌱 XEXP Key Performance Drivers
An ETF (Exchange-Traded Fund) composed of companies involved in exponential technologies—technologies with the potential to radically reshape industries and economies—draws performance from a complex set of drivers. Here are the key performance drivers of such a diversified, innovation-focused ETF:
1. Technological Adoption and Maturity Curves
- Exponential growth technologies (e.g., AI, robotics, genomics) tend to follow S-curves: slow adoption at first, rapid acceleration, then plateau.
- ETF performance is driven by where the portfolio companies are on this curve. Early-phase technologies may underperform short-term but offer high long-term returns.
2. R&D and Innovation Velocity
- Companies leading in patents, R&D spending, and innovation output (e.g., novel AI algorithms, nanomaterials, autonomous systems) are likely to drive long-term alpha.
- Moore’s Law-like dynamics (declining costs + increasing capabilities) favor companies pushing the frontier.
3. Regulatory and Policy Support
- Government incentives for clean energy, healthcare innovation, or fintech regulation significantly impact adoption and profitability.
- Policies such as the Inflation Reduction Act (USA) or EU Digital Markets Act can materially benefit or hinder certain sub-themes.
4. Capital Market Cycles and Risk Appetite
- These ETFs tend to be growth-oriented, with higher volatility and sensitivity to interest rates.
- In a risk-on environment, investor enthusiasm for disruptive innovation can drive outsized returns.
- In rising rate or recessionary environments, these ETFs may underperform due to duration risk (long payoff timelines).
5. Sector and Thematic Rotation
- Exposure to multiple innovation themes (e.g., cloud, fintech, healthcare) means performance will depend on sector rotation dynamics.
- If AI and big data are hot, companies in those themes will buoy the ETF even if others (like next-gen transportation) lag.
6. Global Economic and Geopolitical Trends
- The ETF’s geographic diversification means it’s sensitive to global tech trends, supply chains (e.g., semiconductors), and regulatory ecosystems (e.g., US-China tech tensions).
- Currency fluctuations and country-specific policy can also impact performance.
7. Market Penetration and Commercialization Success
- ETFs investing in early-stage or small/mid-cap firms need successful commercialization of products (e.g., autonomous EVs, quantum computing) to drive revenue and valuations.
- Disruption potential must be matched by business execution.
8. M&A and Strategic Partnerships
- High levels of mergers, acquisitions, and joint ventures often indicate industry consolidation or strategic value recognition, boosting stock prices.
- For example, a big pharma acquiring a biotech firm in the ETF can drive up ETF NAV.
9. Ecosystem Synergies and Value Chain Integration
- Technologies that cross-pollinate (e.g., AI + robotics, or IoT + cloud) can create compounding growth effects.
- The ETF’s performance benefits from exposure to suppliers, platform providers, and end-user innovators across the value chain.
10. Sentiment and Narrative
- These ETFs often respond to media coverage, visionary leadership, and hype cycles.
- Retail and institutional sentiment (e.g., ARK Innovation Fund-type buzz) can be major short-term price drivers.
🔍 XEXP Risk Assessment
As of May 2025, this ETF has only 3 years of history and $20M in assets, which is low, but is rated medium risk by its issuer BlackRock. It can be used strategically to gain exposure to technological innovation across nine themes, including big data & analytics, cloud computing, energy transition, fintech innovation, healthcare innovation, hyperconnectivity, nanotechnology, next-gen transportation, and robotics, however may not be suitable for more risk-adverse investors and those with shorter investment horizons.
Before investing in a newly established ETF with a small amount of assets under management (AUM), be aware of key risks such as low liquidity, which can lead to wider bid-ask spreads and higher trading costs, and closure risk, as small ETFs (typically under $50M–$100M) may shut down if they don’t attract sufficient investor interest, potentially forcing investors to sell at an unfavorable time.
Additionally, such funds may lack a performance track record, have limited institutional backing, and may not efficiently track their underlying index or strategy due to smaller scale.
🧭 XEXP Trend Analysis
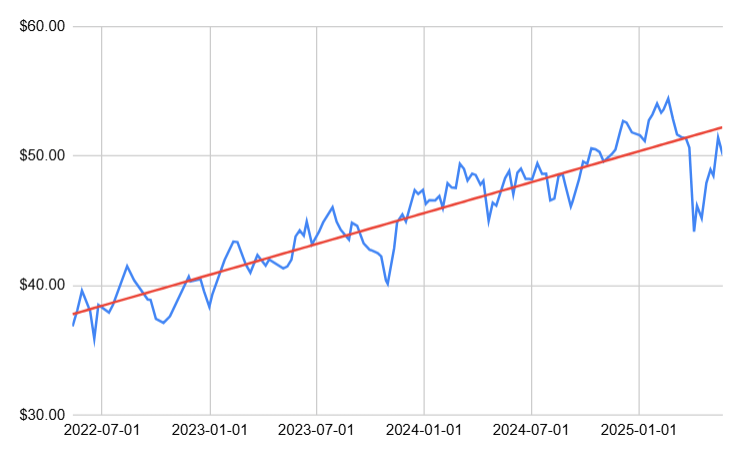
As of May 2025, a linear regression model on 3 years of XEXP timeseries data produces an r-squared of 0.82, indicating a strong upward growth trend in this ETF, with 82% of its price variations explained simply by the passage of time. Keep in mind however, that past performance does not necessarily guarantee future trends will continue the same way.
📉 Key Drivers of the Oct 2023 Decline
1. Rising Interest Rates and Inflation Concerns
In October 2023, the U.S. 10-year Treasury yield surged to nearly 5%, reflecting heightened expectations of prolonged high interest rates due to persistent inflation. This environment adversely affected growth-oriented and speculative stocks, which are prevalent in thematic ETFs focusing on exponential technologies.
2. Investor Rotation to Broad Market Benchmarks
As mega-cap stocks like Nvidia and Meta Platforms drove substantial gains in broad indices such as the S&P 500 and Nasdaq 100, investors shifted capital from thematic ETFs to these broader benchmarks. This rotation led to significant outflows from thematic funds, with the category experiencing $5.8 billion in investor capital losses in 2024, surpassing the $4.8 billion outflows of 2023. (U.S. News Money, XM)
3. Underperformance Relative to Major Indices
Despite some thematic ETFs having substantial holdings in high-performing stocks like Nvidia, they still underperformed compared to broader indices. For instance, the Global X Robotics & Artificial Intelligence ETF, with nearly 13% allocated to Nvidia, only matched the S&P 500’s performance, highlighting the challenges thematic ETFs faced in delivering superior returns during this period. (Wealth Insights, U.S. News Money)
4. Geopolitical Tensions and Market Volatility
The outbreak of conflict between Israel and Gaza in early October 2023 introduced additional market volatility. While defense-related ETFs saw gains, the broader market experienced a downturn, with the S&P 500 declining by 2.2% in October. This geopolitical instability contributed to investor caution, further impacting thematic ETFs. (Nasdaq)
5. Challenges in Clean Energy and Other Sectors
Certain sectors within thematic ETFs, such as clean energy, faced specific headwinds. Rising interest rates increased financing costs, and supply chain disruptions affected profitability, leading to a 17% performance decline and $1.7 billion in outflows for clean energy themes. (Richardson Wealth, Investing.com Canada)
📈 Key Drivers of the Nov 2023 Recovery
1. Cooling Inflation and Anticipation of Fed Rate Cuts
The Consumer Price Index (CPI) for October 2023 showed a year-over-year increase of 3.2%, lower than expected. This bolstered investor confidence that the Federal Reserve might halt further rate hikes and potentially begin cutting rates in 2024. Such expectations led to a decline in Treasury yields, with the 10-year yield dropping from 5% in late October to below 4.4% by the end of November. (Invesco, qtrade.ca)
2. Strong Equity Market Performance
Major stock indices experienced significant gains in November:
- S&P 500: +9%
- Nasdaq Composite: +11%
- Dow Jones Industrial Average: +9%
This broad-based rally was the strongest month for equities in over a year, with approximately 87% of S&P 500 stocks posting gains. (Forbes)
3. Renewed Investor Confidence and Increased ETF Inflows
The improved economic outlook and market performance led to heightened investor confidence. ETFs saw substantial inflows, with $110 billion added in November, including $77 billion into equity ETFs. (Investopedia)
4. Rebound in Technology and Innovation Sectors
Technology stocks, particularly those involved in exponential technologies, rebounded strongly. The Nasdaq Composite’s 11% gain in November reflects this resurgence, benefiting ETFs focused on technological innovation. (markets.businessinsider.com)
5. Improved Economic Indicators
The U.S. economy demonstrated resilience, with third-quarter GDP growth revised upward to 5.2%. Such robust economic performance, coupled with a strong labor market, supported the narrative of a “soft landing,” further boosting investor optimism. (Reddit, qtrade.ca)
📉 Key Drivers of the Mar 2025 Decline
1. Escalation of Trade Wars and Tariffs
In early March, the U.S. administration implemented sweeping tariffs:(cooperators.ca)
- 25% tariffs on imports from Canada and Mexico
- An increase from 10% to 20% on Chinese goods(The Stock Market Watch, indexaco.com)
These actions prompted immediate retaliatory measures from Canada, Mexico, and China, igniting fears of a global trade war. The S&P 500 and Nasdaq experienced their worst quarterly performances since 2022, with declines of 4.6% and 10.5%, respectively. (Reuters)
2. Deteriorating Economic Indicators
Economic data released in February and March signaled a slowdown:(Thrivent Funds)
- The ISM Manufacturing Index fell more than expected.
- The Atlanta Fed’s GDPNow estimate plunged from 2.3% growth in January to a -2.8% contraction in early March.
- Consumer confidence and retail sales declined sharply. (Thrivent Funds)
These indicators heightened concerns about a potential recession.
3. Surging Inflation Expectations
Inflationary pressures intensified due to tariffs increasing input costs:(Thrivent Funds)
- January’s Consumer Price Index (CPI) rose by 0.5%, the largest monthly increase since August 2023.
- Core CPI, excluding food and energy, rose by 0.4%, surpassing expectations. (Thrivent Funds)
These developments complicated the Federal Reserve’s efforts to manage inflation and interest rates.
4. Tech Sector Vulnerabilities
The technology sector, heavily represented in your ETF, faced significant challenges:
- The Nasdaq Composite dropped 4% on March 10, marking its largest one-day decline since October 2022.
- Major tech companies like Tesla, Apple, and Nvidia experienced substantial stock price declines. (Simply Ethical)
These declines were driven by concerns over high valuations, increased competition, and the impact of tariffs on global supply chains.
5. Investor Sentiment and Market Dynamics
The combination of trade tensions, economic slowdown, and sector-specific issues eroded investor confidence:(Simply Ethical)
- The University of Michigan’s Consumer Sentiment Index fell sharply in March, marking the third consecutive month of decline.
- Investors shifted assets toward traditionally defensive sectors, such as consumer staples, utilities, and healthcare. (myspg.com, Simply Ethical)
This shift away from growth-oriented sectors contributed to the ETF’s decline.
The recovery of your thematic ETF during April and May 2025 was driven by a combination of macroeconomic shifts, policy changes, and sector-specific rebounds. Here’s an analysis of the key factors:
📈 Key Drivers of the April–May 2025 Recovery
1. Easing of Trade Tensions
In early April, the U.S. administration announced a pause on planned tariff increases, leading to a significant market rally. By May 12, the U.S. and China agreed to a temporary deal reducing tariffs for 90 days, which bolstered investor confidence and contributed to the S&P 500 turning positive for the year by May 13. (Wikipedia)
2. Rebound in Technology and Innovation Sectors
Big Tech stocks, particularly the “Magnificent Seven”—Nvidia, Amazon, Microsoft, Alphabet, Meta, Tesla, and Apple—experienced a significant rebound in May, recovering from earlier losses caused by tariff shocks. This resurgence was fueled by strong earnings reports and optimism surrounding artificial intelligence advancements. (MarketWatch)
3. Improved Consumer Confidence
After five consecutive months of decline, U.S. consumer confidence rebounded in May, with the index rising by over 12 points. This increase was largely attributed to the U.S.-China tariff reduction agreement, which alleviated economic anxieties and supported consumer spending. (Time)
4. Monetary Policy Support
The Federal Reserve signaled a willingness to look past temporary inflation tied to tariffs, focusing on broader economic trends. This stance, coupled with expectations of potential interest rate cuts if needed, provided additional support to the equity markets. (theaustralian)
5. Fiscal Stimulus and Government Spending
The U.S. government’s increased spending through a Continuing Resolution defied expectations of budget cuts, suggesting continued fiscal support in 2025. This fiscal stimulus contributed to economic growth and market optimism. (theaustralian)
Disclaimer
The content provided on this blog is for informational purposes only and does not constitute financial, investment, or other professional advice. The opinions expressed herein are those of the author(s) and do not reflect the views of any affiliated organizations or institutions.
All investment strategies and investments involve risk of loss. Nothing in this blog should be construed as a recommendation, solicitation, or offer to buy or sell any securities or other financial instruments. You are solely responsible for your investment decisions and should seek the advice of a qualified financial advisor or other professional before making any financial decisions.
The information on this site is provided “as is” without any representations or warranties, express or implied. The author(s) make no representations or warranties in relation to the accuracy, completeness, timeliness, or reliability of any information on this site or found by following any link on this site.
Past performance is not indicative of future results. The author(s) may hold positions in or have other financial interests in securities discussed on this blog.
By using this blog, you agree not to hold the author(s) liable for any losses, damages, or expenses that may arise from reliance on the information provided.
