🌱 XQLT Key Performance Drivers
For an ETF with exposure to large- and mid-cap U.S. stocks that exhibit positive fundamentals—such as high return on equity (ROE), stable earnings growth, and low financial leverage—key performance drivers would include both macro-level and micro-level factors. Here’s a breakdown:
1. Fundamental Quality of Holdings
- Sustained High ROE: Companies with high ROE often have strong competitive advantages (economic moats), efficient capital allocation, and strong profitability.
- Earnings Growth Stability: Stable and predictable earnings attract long-term investors and typically reduce downside risk.
- Low Financial Leverage: These companies are less sensitive to interest rate fluctuations and financial stress, offering resilience in volatile markets.
2. Macroeconomic Environment
- Interest Rate Environment:
- Low or falling interest rates tend to benefit growth-oriented, high-quality stocks (e.g., those with strong earnings and low debt).
- Rising rates could challenge valuations, but low-leverage firms might be less adversely impacted.
- Inflation Trends:
- Moderate inflation generally supports earnings growth.
- High inflation could erode margins unless companies have strong pricing power (which many high-ROE firms do).
- GDP Growth:
- These stocks typically perform well during economic expansions when corporate earnings are growing.
- During downturns, their quality characteristics (e.g., stable earnings) may offer downside protection.
3. Market Sentiment Toward Quality Factors
- This ETF likely leans toward quality and growth factors. If market sentiment favors quality stocks (e.g., during risk-off periods or late-cycle investing), performance can be strong.
- Performance may lag during momentum- or value-driven rallies (e.g., recovery phases where cyclical and lower-quality stocks surge).
4. Sector Exposure
- Quality screens (high ROE, low debt, stable earnings) often overweight sectors like:
- Information Technology
- Healthcare
- Consumer Staples
- Underweight in:
- Financials (due to high leverage)
- Utilities or Energy (cyclical earnings, capital intensity)
- Sector composition can affect ETF returns depending on sector rotation trends in the broader market.
5. Valuation Multiples
- These stocks may trade at a premium valuation due to their strong fundamentals.
- ETF performance can be impacted if the market undergoes a valuation correction.
- However, the premium is often justified by consistent earnings and capital efficiency.
6. Earnings Season Results
- ETFs with fundamentally strong stocks tend to respond well during earnings beats and suffer less during misses.
- Consistent quarterly performance from constituents can drive ETF outperformance.
7. Index Rebalancing & Methodology
- If the ETF is rules-based, how it rebalances based on updated fundamentals (e.g., ROE or earnings revisions) will influence performance.
- The frequency and strictness of the screening criteria determine exposure to newly emerging or fading quality names.
🔍 XQLT Risk Assessment
As of June 2025, XQLT is rated as moderate risk level by its issuer BlackRock. This ETF has 6 years of history and $180M in net assets, which are both below the average of 11 years and $1B compared to all iShares ETFs listed on the TSX.
Before investing in a ETF that is relatively newer and has lower assets under management than more established and popular ones, be aware of key risks such as low liquidity, which can lead to wider bid-ask spreads and higher trading costs.
XQLT can be used strategically to gain access to a specific factor view which has historically driven a significant part of companies’ risk and return, however may not be suitable for more risk-adverse investors and those with shorter investment horizons.
Investing in an ETF that targets large- and mid-cap U.S. stocks with positive fundamentals—high return on equity (ROE), stable year-over-year earnings growth, and low financial leverage—typically carries lower fundamental risk than the broader market. However, it is not risk-free. Here’s a breakdown of the key risks:
1. Valuation Risk
- Quality stocks often trade at a premium (higher P/E or P/B ratios), which can expose the ETF to multiple compression if market sentiment shifts or earnings growth slows.
- In market rotations toward value or cyclical names, these ETFs may underperform despite strong fundamentals.
2. Interest Rate Risk
- Quality/growth-oriented stocks tend to be more sensitive to rising interest rates, which increase the discount rate applied to future earnings.
- Low-leverage firms are relatively insulated from higher borrowing costs, but equity valuations may still suffer in a rising-rate environment.
3. Sector Concentration Risk
- Fundamental filters like high ROE and earnings stability often overweight certain sectors, such as:
- Information Technology
- Healthcare
- Consumer Staples
- This can lead to underexposure to sectors like Energy, Financials, or Industrials, which might outperform in certain economic cycles.
4. Factor Rotation Risk
- The ETF is tilted toward the quality factor. If market leadership shifts to other factors—such as value, momentum, or small-cap stocks—performance may lag.
- These shifts often happen during economic recoveries or in response to policy changes.
5. Limited Upside in Bull Markets
- High-quality companies tend to offer more downside protection but may underperform during strong bull markets, particularly when lower-quality, higher-beta stocks rally sharply.
6. Macroeconomic & Systemic Risks
- Despite strong fundamentals, the ETF is not immune to systemic risks:
- Market-wide sell-offs (e.g., due to geopolitical tensions, pandemics)
- Recession fears
- Credit crises
- These events can hurt even the best companies due to broad-based de-risking.
Overall Risk-Reward Tradeoff
- Pros:
- Defensive characteristics (strong balance sheets, steady earnings)
- Lower drawdowns historically vs. broader market
- Suitable for long-term, risk-aware investors
- Cons:
- May lag in high-beta, speculative market rallies
- Can become expensive in late-stage bull markets
- Subject to macro headwinds despite strong fundamentals
🧭 XQLT Trend Analysis
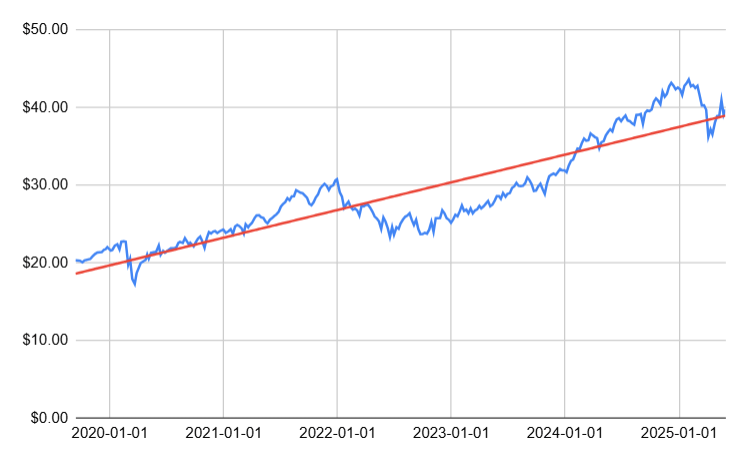
As of June 2025, a linear regression model on 6 years of XQLT timeseries data produces an r-squared of 0.81, indicating a strong upward growth trend in this ETF with 81% of its price variations explained simply by the passage of time. Keep in mind however, that past performance does not necessarily guarantee future trends will continue the same way.
📈 Key Drivers of XQLT’s Growth Trend from May 2020 to Dec 2021
1. Ultra-Accommodative Monetary Policy
- The Federal Reserve slashed interest rates to near-zero in March 2020 and committed to keeping them low.
- Massive quantitative easing (QE): The Fed purchased billions in Treasuries and mortgage-backed securities, injecting liquidity into markets.
- Low interest rates made growth stocks (whose cash flows are farther in the future) more attractive due to lower discount rates.
2. Fiscal Stimulus on an Unprecedented Scale
- U.S. government passed several stimulus packages:
- CARES Act (March 2020)
- Consolidated Appropriations Act (Dec 2020)
- American Rescue Plan (March 2021)
- These included direct payments to individuals, enhanced unemployment benefits, and small business loans—fueling consumer spending and investor enthusiasm.
3. Acceleration of Digital Transformation
- COVID-19 supercharged demand for technology and digital services:
- Remote work, e-commerce, cloud computing, streaming, telehealth, fintech.
- High-growth companies (e.g., Apple, Microsoft, Amazon, Nvidia, Zoom, Shopify) benefited from secular tailwinds.
4. Retail Investor Boom
- Platforms like Robinhood and commission-free trading enabled a surge in retail participation.
- Stimulus checks + stay-at-home orders = increased trading activity.
- Social media (e.g., Reddit, Twitter, TikTok) played a role in promoting speculative behavior and momentum in growth/tech stocks.
5. Low Inflation Expectations (Initially)
- Through much of 2020 and early 2021, inflation remained subdued.
- This bolstered confidence in high-multiple growth stocks, which are more sensitive to inflation and rate expectations.
6. Corporate Earnings Recovery
- After the initial COVID shock in Q1 2020, corporate earnings rebounded quickly—particularly in tech and healthcare.
- Many large-cap growth firms posted record revenues and profits, justifying their high valuations.
7. Strong IPO and SPAC Activity
- Explosive IPO market (e.g., Snowflake, Airbnb, DoorDash) and SPAC boom created risk-on sentiment, lifting the entire growth segment.
- Capital was cheap and abundant, supporting early-stage, high-growth business models.
8. Weak U.S. Dollar
- A weakening dollar through much of 2020 increased foreign investment in U.S. equities and boosted multinationals’ revenues when repatriated.
📉 Key Drivers of XQLT’s Decline Trend from Jan-Jun 2022
1. Rapid Rise in Interest Rates
The Federal Reserve began aggressively hiking rates in response to persistently high inflation. This had a direct impact on:
- Valuations: Quality stocks, often priced at a premium due to strong fundamentals, saw P/E multiples compress as the discount rate applied to future earnings rose.
- Investor rotation: As rates increased, investors rotated out of longer-duration equity exposures like growth and quality stocks into value, energy, and cyclical sectors.
2. Sticky, Surging Inflation
- CPI hit multi-decade highs in early 2022. That rattled markets and increased pressure on the Fed to act aggressively.
- Even though XQLT includes low-leverage, stable-growth firms, many still face margin pressure from:
- Higher input costs
- Rising wages
- Supply chain disruptions
- Investors feared that inflation would erode real earnings growth, even for high-quality companies.
3. Valuation Mean Reversion
- Quality stocks like those in XQLT had benefited from valuation expansion during 2020–2021.
- In 2022, the market shifted focus from “growth at any price” to “profit at a reasonable price.”
- Many top holdings (especially in tech and healthcare) saw valuation corrections, even if their fundamentals remained solid.
4. Underweight in Energy and Value Sectors
In Q1 2022, energy and commodity sectors were top performers, benefiting from:
- War in Ukraine
- Tight global supply chains
- Inflation hedging behavior
- XQLT typically underweights these sectors due to their cyclical and volatile fundamentals, which don’t score well on quality metrics (like stable ROE or low leverage).
- This underexposure hurt relative and absolute performance during a time when energy led the market.
5. Tech Exposure Headwinds
- Many of XQLT’s top holdings are mega-cap tech firms (e.g., Apple, Microsoft, Nvidia), which suffered from:
- Rate sensitivity
- Regulatory pressures
- Slowing growth comps post-COVID
- As the NASDAQ fell, XQLT declined alongside it—even if its holdings were stronger fundamentally than more speculative tech.
6. Geopolitical Uncertainty
- Russia’s invasion of Ukraine in February 2022 created a global risk-off environment, affecting equities broadly.
- Even high-quality names were not immune to selling pressure, as global funds de-risked portfolios and rotated to cash, commodities, and defensive value sectors.
7. Strong U.S. Dollar
- The U.S. dollar strengthened sharply as rates rose and global uncertainty grew.
- A strong dollar negatively affects multinational firms’ foreign earnings, which many XQLT constituents depend on.
📈 Key Drivers of XQLT’s Growth Trend from Nov 2022 to Jan 2025
1. Peak Inflation & Declining Interest Rate Expectations
- By late 2022, U.S. inflation showed signs of peaking, which reduced pressure on the Fed to maintain aggressive rate hikes.
- Markets began pricing in a softening in monetary policy by mid-2023.
- Lower long-term rates favored high-quality, low-leverage companies whose valuations are sensitive to interest rate expectations.
- The anticipated Fed pivot narrative gave growth and quality stocks room to recover and expand.
2. Flight to Quality Amid Economic Uncertainty
- Ongoing concerns about a possible mild recession or slowing economic growth made investors favor:
- Companies with strong balance sheets
- Consistent earnings growth
- Low debt and capital efficiency
- XQLT benefited as investors sought defensive growth rather than speculative or cyclical plays.
3. Strong Performance of Mega-Cap Tech and Quality Leaders
- Major constituents of XQLT like Apple, Microsoft, Nvidia, and Visa led market gains during this period.
- These companies:
- Posted resilient earnings
- Participated in the AI-driven growth narrative
- Took market share amid economic softness
- The quality-growth hybrid profile of these firms fit market sentiment perfectly.
4. AI & Productivity Investment Wave
- The boom in artificial intelligence (AI) and automation from early 2023 onward sparked strong demand for companies involved in:
- Semiconductors
- Cloud computing
- Enterprise software
- Many of these companies—especially those with high ROE and efficient capital use—are core to XQLT’s portfolio.
- Investors rewarded scalable, innovative companies that could sustain margins and earnings.
5. Resilient Corporate Earnings
- Even as parts of the economy cooled in 2023, XQLT constituents consistently beat earnings expectations.
- Unlike speculative growth stocks, these companies demonstrated:
- Stable cash flows
- Disciplined cost management
- Shareholder returns (e.g., dividends, buybacks)
- That made them outperform both during risk-off phases and risk-on rallies.
6. Decline in Market Volatility & VIX
- From mid-2023 onward, declining volatility (lower VIX) and greater macro visibility boosted risk appetite—but quality was still favored.
- Investors re-allocated to ETFs like XQLT as a “core growth allocation”, rather than chasing speculative small-caps or meme stocks.
7. Rebalancing Flows into Factor-Based ETFs
- The return of factor investing—especially quality and profitability factors—led to institutional flows into smart beta ETFs like XQLT.
- As broader passive index investing rebalanced, quality factor ETFs captured more inflows, supporting price gains.
8. Favorable Sector Exposure
- XQLT’s tilt toward tech, healthcare, and consumer staples aligned well with market leadership.
- Its underweight in financials, energy, and deep cyclicals shielded it from volatility in those areas.
📉 Key Drivers of XQLT’s Decline Trend from Feb-Apr 2025
1. Rising Interest Rate Repricing (Again)
- Markets in early 2025 repriced expectations for rate cuts, either due to:
- Sticky services inflation, or
- Stronger-than-expected labor market data
- This led to a renewed rise in Treasury yields, which hurt:
- High-duration equity assets, including quality and growth stocks
- P/E multiples, particularly for firms trading at elevated valuations
XQLT, with many high-ROE, tech-heavy names, was hit by this yield-sensitive valuation compression.
2. Rotation into Value and Cyclicals
- Investors rotated into value, financials, and industrials, driven by:
- Re-acceleration in global manufacturing or capex
- Relative underperformance of cyclical sectors in 2024
- XQLT, which tends to underweight these sectors, lagged as leadership changed.
3. Profit-Taking in Mega-Cap Tech
- After a strong run from 2023 into early 2025, investors took profits in mega-cap tech stocks, which form a large portion of XQLT.
- Even slight earnings disappointments or margin warnings led to outsized pullbacks, especially in firms that were priced for perfection (e.g., Microsoft, Nvidia, Apple).
4. Renewed Geopolitical or Regulatory Risks
- Potential shocks during this period (e.g., renewed trade tensions, tech regulation proposals, or international conflict) may have:
- Spooked global investors
- Led to de-risking from large-cap U.S. multinationals, which dominate XQLT
5. Crowding & Factor Reversal
- As quality factor ETFs like XQLT outperformed from 2023 into early 2025, positioning became crowded.
- A factor unwind or quant-driven rotation out of “quality” and into higher-beta or higher-yielding plays likely amplified the drawdown.
- Market regimes sometimes trigger brief reversals of even strong long-term factors when trades are overextended.
6. Earnings Caution or Margin Compression
- While not a collapse, several key XQLT constituents may have issued cautious forward guidance due to:
- Slower revenue growth
- Rising costs in areas like labor, AI infrastructure, or input inflation
- Even a mild deceleration in EPS growth could spark selling in high-quality stocks trading at a premium.
Disclaimer
The content provided on this blog is for informational purposes only and does not constitute financial, investment, or other professional advice. The opinions expressed herein are those of the author(s) and do not reflect the views of any affiliated organizations or institutions.
All investment strategies and investments involve risk of loss. Nothing in this blog should be construed as a recommendation, solicitation, or offer to buy or sell any securities or other financial instruments. You are solely responsible for your investment decisions and should seek the advice of a qualified financial advisor or other professional before making any financial decisions.
The information on this site is provided “as is” without any representations or warranties, express or implied. The author(s) make no representations or warranties in relation to the accuracy, completeness, timeliness, or reliability of any information on this site or found by following any link on this site.
Past performance is not indicative of future results. The author(s) may hold positions in or have other financial interests in securities discussed on this blog.
By using this blog, you agree not to hold the author(s) liable for any losses, damages, or expenses that may arise from reliance on the information provided.
