🌱 XSUS Key Performance Drivers
The performance of an ETF that has exposure to a portfolio of large and mid cap U.S. stocks emphasizing companies that have positive environmental, social, and governance (ESG) characteristics could be driven by a variety of market-related, sectoral, and ESG-specific factors.
1. Overall U.S. Equity Market Performance
- S&P 500 & Russell 1000 trends: XSUS tracks large- and mid-cap U.S. stocks, so broader index movements have a direct impact.
- Economic growth, interest rate outlook, and inflation trends influence the market-wide equity environment.
2. Sector Allocation Bias
ESG-focused ETFs typically underweight “brown” sectors and overweight “green”/tech sectors:
- Underweight: Energy (especially fossil fuels), Utilities, some Industrials.
- Overweight: Technology, Healthcare, Financials with strong ESG profiles.
This makes performance highly sensitive to sector rotations:
- If tech outperforms, XSUS likely benefits.
- If energy rallies, XSUS may underperform traditional benchmarks.
3. ESG Tilt Effects
The ESG screening process affects both risk and return:
- Exclusion of poor ESG performers reduces exposure to controversies, lawsuits, or reputational damage (e.g., environmental disasters, labor issues).
- Inclusion of high-ESG firms may offer long-term performance resilience and potentially lower volatility.
4. Company-Level ESG Improvements
Stocks in the portfolio may improve their ESG ratings over time:
- This can lead to increased institutional interest, lower cost of capital, and higher long-term valuation multiples.
5. Flow of Funds into ESG Products
As ESG investing grows, more capital may flow into ETFs like XSUS:
- This can create positive feedback loops: increasing demand leads to higher prices for ESG stocks.
6. Interest Rates and Macro Policy
- Growth-oriented ESG portfolios (often tech-heavy) are sensitive to rate changes:
- Rising rates → pressure on growth stock valuations.
- Lower rates → tailwinds for high-duration assets (like tech-heavy ESG stocks).
7. Regulatory & Policy Developments
- U.S. or global policies around carbon taxation, climate disclosures, diversity mandates, etc., can boost or hurt ESG-related firms.
- Any policy shift that increases the cost of carbon emissions or mandates ESG reporting tends to favor ESG-aligned companies.
8. Corporate Governance Quality
- Companies with strong governance are more likely to:
- Manage risks well,
- Deliver consistent performance,
- Avoid scandals or shareholder activism.
These traits typically improve long-term capital efficiency and investor confidence.
🚨 Why Tech Companies Tend to Score Higher on ESG:
1. Lower Direct Environmental Impact (E)
- Tech companies (especially software and services firms) typically:
- Consume less energy compared to industrials or energy companies.
- Have lower greenhouse gas emissions.
- Don’t produce physical pollutants or hazardous waste.
- Compared to oil, mining, or manufacturing, the carbon footprint per dollar of revenue is much smaller.
2. Modern Corporate Governance (G)
- Many tech firms are newer and often:
- Have more diverse, independent boards.
- Adopt modern shareholder engagement practices.
- Are quicker to disclose ESG metrics and policies (transparency helps ratings).
- Governance frameworks in large-cap tech tend to be cleaner (though not perfect — dual-class shares in Big Tech are controversial).
3. Social Policies (S) & Talent Practices
- Tech companies often:
- Lead on diversity, equity, and inclusion (DEI) initiatives.
- Provide generous employee benefits (health, parental leave, remote work).
- Engage in supply chain ethics programs (like conflict-free minerals sourcing).
- These are all areas ESG raters use to assign high “S” scores.
4. Disclosure & ESG Engagement
- Big tech firms often invest heavily in ESG reporting, sustainability teams, and proactive investor communication.
- This creates higher scores simply because they report more data — many ESG rating systems favor transparency and disclosure.
5. Influence of ESG Rating Methodologies
- ESG ratings are relative to industry peers:
- Tech firms are not being compared to oil or mining — they’re scored against other tech companies.
- So a firm like Microsoft will easily outperform peers on ESG metrics due to its early and broad sustainability push.
But There Are Important Critiques
Critics argue:
- Big Tech can have social downsides (e.g., privacy issues, misinformation, labor practices in gig economy).
- Carbon emissions from data centers are rising fast.
- Dual-class voting structures (e.g., Meta, Alphabet) can hurt governance fairness.
- These are often underweighted or overlooked in scoring systems that prioritize disclosure and risk mitigation.
🔍 XSUS Risk Assessment
Investing in XSUS carries many of the same risks as investing in the broader U.S. equity market, but with some distinct ESG-related and structural risks. Here’s a breakdown:
1. Market Risk (High)
- XSUS is equity-based and tracks large/mid-cap U.S. stocks — subject to:
- Broad market volatility
- Economic cycles, inflation, recession fears
- Geopolitical risks
- No downside protection — full participation in drawdowns (like during COVID or 2022 rate hikes)
- Risk similar to S&P 500 or Russell 1000 ETFs
2. Sector Concentration Risk (Moderate to High)
- ESG screening tilts the portfolio toward certain sectors:
- Overweight: Technology, Financials, Healthcare
- Underweight: Energy, Utilities, Materials (often excluded for ESG issues)
- This creates style bias — XSUS may underperform when fossil fuels or “dirty” sectors rally.
- During energy booms or commodity surges, ESG funds like XSUS often lag
3. Tracking Error / Benchmark Risk (Low to Moderate)
- XSUS is not identical to the S&P 500 or traditional indices:
- It tracks an ESG-aware benchmark (like MSCI USA Extended ESG Focus Index)
- So performance may diverge from traditional market benchmarks — positively or negatively
- Investors expecting S&P-like returns might experience surprise deviations
4. ESG Methodology Risk (Moderate)
- ESG scores vary by provider (MSCI, Sustainalytics, etc.) and can be subjective.
- Investors are exposed to:
- Rating inconsistencies
- Greenwashing risk — some firms with high ESG scores may have real-world controversies
- Backlash risk — ESG investing is under increasing political scrutiny
- A high ESG score doesn’t guarantee ethical or sustainable corporate behavior
5. Interest Rate Sensitivity (Moderate)
- Tech- and growth-leaning ESG funds like XSUS are more vulnerable to:
- Rising rates (which lower present value of future earnings)
- Tightening monetary policy (Fed hikes, QT)
- Seen in 2022 when growth-heavy ESG funds underperformed during aggressive Fed tightening
6. Liquidity & Fund Structure Risk (Low)
- XSUS is a large, liquid ETF with strong backing (e.g., iShares/BlackRock), so:
- Low bid/ask spreads
- Easy to trade in/out
- However, liquidity could drop in extreme stress events (e.g., March 2020)
- Not a concern in normal markets, but still part of systemic ETF risk
7. Valuation Risk (Moderate)
- Since ESG portfolios often lean toward growth and quality stocks, there’s potential for:
- Overvaluation relative to value or cyclical sectors
- Compressed multiples if market rotates toward value or low-duration assets
- Monitor forward P/E and sector valuations within the ETF
💡 Who Should Consider XSUS?
Suitable for:
- Long-term investors wanting broad U.S. equity exposure with ESG filtering
- Investors aligned with sustainable or impact investing
- Those willing to accept tracking and style biases
Less suitable for:
- Tactical traders
- Investors seeking pure S&P 500 beta
- Those skeptical of ESG methodologies or favoring value/energy sectors
🧭 XSUS Trend Analysis
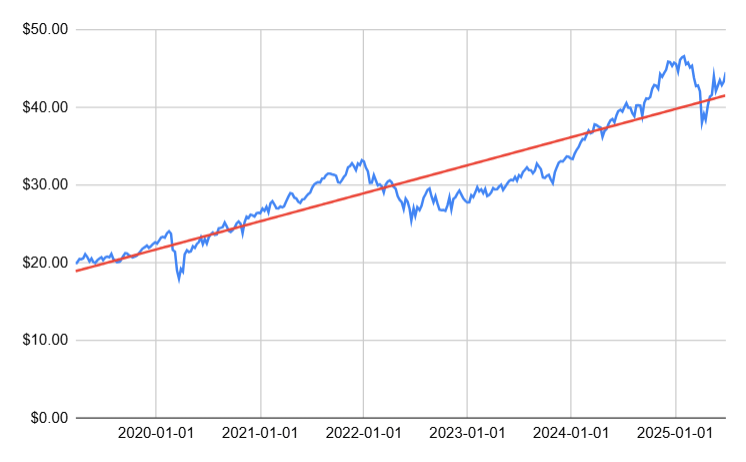
As of July 2025, a linear regression model on 6 years of XSUS timeseries data produces an r-squared of 0.85, indicating a strong upward growth trend in this ETF with 85% of its price variations explained simply by the passage of time. Keep in mind however, that past performance does not necessarily guarantee future trends will continue the same way.
📈 Key Drivers of XSUS’s Growth Trend from May 2020 to Dec 2021
1. Explosive Tech/Growth Rally
- The U.S. equity bull market rebounded strongly after the COVID dip — especially in growth stocks.
- XSUS’s tilt toward high‑ESG, large-cap growth names (e.g., Microsoft, Apple, Tesla) meant it rode this wave hard .
2. Sector Asymmetry: Energy Lag, Tech Boom
- Energy & materials remained underweight in the fund due to ESG screening.
- Meanwhile, Tech, Healthcare, Financials were overweight — aligning with what outperformed from mid‑2020 through 2021.
3. Massive ESG Fund Inflows
- Interest in ESG investing surged during the pandemic.
- Investors gravitated toward funds like XSUS, further driving up prices of ESG-screened, high-quality firms.
4. Low Interest Rate & QE Environment
- The Fed’s ultra-low interest rates and bond buying created a favorable backdrop for growth stocks with long-duration earnings, boosting valuations.
5. Superior ESG Momentum & Governance Disclosures
- Many tech and consumer-focused ESG leaders were accelerating in ETFs’ ESG scoring thanks to transparency, environmental pledges, and governance policies.
- Companies improving their ESG narrative attracted further investor interest.
6. Dividend Consistency
- XSUS maintained a steady dividend yield (~1.1%) throughout 2020–21 .
- While small relative to growth returns, it provided a reliable income stream and enhanced attractiveness.
📉 Key Drivers of XSUS’s Decline from Jan–June 2022
1. Interest Rate Hikes & Inflation Surge
- The Federal Reserve began aggressively raising interest rates to combat surging inflation.
- Rising rates hit growth stocks hardest, especially those with high future earnings expectations (like tech).
- XSUS, with its tech-heavy tilt, was disproportionately impacted.
2. Tech Sector Selloff
- Mega-cap tech names like Apple, Microsoft, Amazon, and Tesla (all major holdings in XSUS) saw sharp corrections:
- Tech valuations were under pressure from rising rates and weaker earnings outlooks.
- Nasdaq dropped ~30% in H1 2022, dragging XSUS down due to its sector weight.
3. Energy Outperformance — But Underweight in XSUS
- The energy sector surged during this period due to:
- Russia’s invasion of Ukraine
- Oil prices hitting $100+/barrel
- XSUS underweights or excludes fossil fuel producers due to ESG screens, so it missed one of the few winning sectors.
4. Rotation from Growth to Value
- Market shifted toward value stocks (like banks, industrials, and energy), while ESG-leaning portfolios like XSUS remained growth-oriented.
- This style rotation hurt relative performance.
5. Geopolitical & Macro Uncertainty
- Russia-Ukraine war added to global risk aversion.
- Supply chain disruptions, inflation, and global slowdown fears hurt investor sentiment.
- ESG portfolios didn’t offer protection from these macro shocks.
6. Valuation Compression
- XSUS held many stocks with elevated price-to-earnings multiples from the 2020–2021 bull market.
- As multiples compressed market-wide, high-valuation ESG stocks were hit hardest.
📈 Key Drivers of XSUS’s Growth Trend from July 2022 to Jan 2025
1. Rotation Back into Growth & Tech
- After underperforming in early‑2022, markets shifted back to growth and large-cap tech, favored by lower volatility and stabilization in rates.
- Tech-heavy positioning—Apple, Microsoft, Amazon, Nvidia—allowed XSUS to recover strongly.
2. Federal Reserve Pivot & Lower Rates
- The Fed paused and began considerations of rate stabilization starting mid‑2023.
- Easing inflation reduced rate-induced pressure on growth stocks, benefiting ESG/future‑growth tilted funds like XSUS.
3. Resurgent ESG Flows & Narrative
- Despite some headwinds in 2024, demand for ESG strategies remained solid.
- Corporate disclosures on climate targets, governance enhancements, and social initiatives boosted ESG sentiment – helping inflows and valuations .
4. Sector Composition & Earnings Resilience
- XSUS’s overweight in healthcare and financials, alongside tech, provided resilience:
- Healthcare outperformed in 2023 with biotech rebounds.
- Financials benefited from stable consumer demand and normalized/spread environment.
- This balanced sector exposure cushioned volatility and contributed to steady growth.
5. Improved Valuations & Re-rating
- Post-2022, many high-quality growth names had price dips.
- From 2023 onward, investors began re-rating tech and large-cap ESG-aligned stocks, boosting multiple expansions and total returns.
6. Sustainability Credentials
- Morningstar awarded XSUS 4 globes, with “Low Carbon Designation” due to limited fossil fuel exposure and strong carbon solutions weighting morningstar.com.
- ESG-focused investors prioritized low-carbon portfolios as regulations and climate risk awareness grew—this added to inflows and valuation support.
Disclaimer
The content provided on this blog is for informational purposes only and does not constitute financial, investment, or other professional advice. The opinions expressed herein are those of the author(s) and do not reflect the views of any affiliated organizations or institutions.
All investment strategies and investments involve risk of loss. Nothing in this blog should be construed as a recommendation, solicitation, or offer to buy or sell any securities or other financial instruments. You are solely responsible for your investment decisions and should seek the advice of a qualified financial advisor or other professional before making any financial decisions.
The information on this site is provided “as is” without any representations or warranties, express or implied. The author(s) make no representations or warranties in relation to the accuracy, completeness, timeliness, or reliability of any information on this site or found by following any link on this site.
Past performance is not indicative of future results. The author(s) may hold positions in or have other financial interests in securities discussed on this blog.
By using this blog, you agree not to hold the author(s) liable for any losses, damages, or expenses that may arise from reliance on the information provided.
